Valuable Tools for the Institutional Research Toolbox: Time Series and Space-Time Approaches to Data Analysis
introduction
The Kentucky Community and Technical College System (KCTCS) was recently awarded a research grant from the James Graham Brown Foundation to develop an innovative geographic information system (GIS) application that combines education, workforce, public health, and socioeconomic data with a central focus on promoting a better understanding of education and workforce alignment in Kentucky. KCTCS partnered with the American Institutes for Research (AIR) and Education Strategy Group (ESG) to develop the GIS application, and collaborated with the Council on Postsecondary Education (CPE), the Kentucky Department of Education (KDE), the Kentucky Workforce Innovation Board (KWIB), the Talent Pipeline Management System (TPMS), and the Kentucky Center for Statistics (KYStats) on data collection and project planning. The Office of Research and Policy Analysis (ORPA) at KCTCS is currently working with AIR and ESG to finalize Version 1 of the application with a planned release in early 2021.
An important aspect of the ongoing development of the GIS application is research on “key insights” into the application’s data. The information in the application covers a wide range of data, which means research is needed to find important relationships that help guide users to a better understanding of important issues. As researchers worked to identify key insights in the GIS application, time series and space-time modeling emerged as important approaches for taking advantage of data with both spatial and temporal dimensions. Practical applications of these techniques in institutional research (IR) offices are numerous. For example, tracking student enrollment by home county, over time, could potentially reveal counties that have become hotspots for enrollment, while also revealing counties that very rarely send students to a particular college. This research brief will link the lessons learned from the GIS application research on time series and space-time models to practical applications in other IR analyses.
To demonstrate the applicability of time series and space-time models to IR-related data sources, this research brief will explore the impact of COVID-19 on jobs in Kentucky counties, which is an important topic related to workforce education in Kentucky. Then the research brief will apply space-time models to enrollment data that are more regularly used by IR offices. The space-time models allow for the creation of two-dimensional (2D) maps that show trends in data over time, which is an advantage over traditional 2D maps that only show variables at a single point in time.
Methodology
The focus of the research brief is on the importance of considering time when using maps to visualize data. To begin the exposition of space-time models this report will focus on jobs in Kentucky counties to illustrate an important finding from the GIS application research – including analytic processes that focuses on the intersection between spatial and temporal aspects of data lead to key insights that were not initially obvious. The data structure used in this research is three-dimensional (3D), which means variables are measured both spatially and temporally. Formally, this data structure is called a space-time cube because when data are visualized in 3D they appear to look like stacks of cubes. Figure 1 shows an example of a space-time cube for manufacturing jobs in Kentucky counties measured each year from 1990 through the second quarter of 2020. Each year is represented by a single cube, which is stacked to create the shape of a tower. The top of the tower is the cube representing the final observation in 2020 and at the bottom of the tower is the cube representing the first observation in 1990. The space-time approach can be applied to any data that has both spatial and temporal components including many variables commonly used in institutional research.
Figure 1: 3D Visualization of Space-Time Cube for Manufacturing Jobs in Kentucky Counties
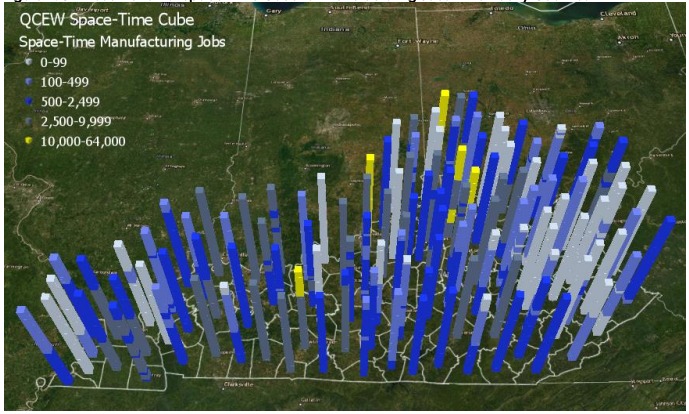
The data used to calculate the space-time cubes come from the Quarterly Census of Employment and Wages (QCEW), which is a quarterly survey of jobs and wages across multiple industry sectors at the county level. The QCEW data were downloaded in Excel format from KYSTATS. The data are downloaded in “long” format, which is needed for the calculation of space-time cubes. Prior to calculating the space[1]time cubes, the QCEW time series data were used to create county-level forecasts of jobs out to 2025. The QCEW forecasts are one aspect of the GIS application that is focused on looking at the projected number of jobs across 20 industry sectors. The purpose of the forecasts in the GIS application is that it provides a proactive look at both education and workforce data throughout the state. While the forecasts are important for understanding where jobs are trending, the space-time approach builds on the forecasts by applying additional analyses that evaluate the growth patterns of forecasts. The 3D visualization in Figure 1 shows many counties in Eastern Kentucky have experienced consistently low numbers of manufacturing jobs as indicated by the blue monochrome towers. However, many counties throughout the state have experienced substantial variation in the trends as new companies move in and out as indicated by towers with oscillating colors. These patterns are interesting and can be used to identify important patterns in the data that may not be obvious when viewed in other formats.
Question 1: What were the projected trends in jobs prior to the COVID-19 pandemic in Kentucky counties, and how did they change after the pandemic?
To answer Question 1, we will use the QCEW space-time cube to create 2D maps that represent the type of job trends that existed before and after the onset of the COVID-19 pandemic. Prior to the COVID-19 pandemic, the U.S. and global economies were performing well with low unemployment rates and growing job demand. To capture the trends in jobs in Kentucky counties prior to the COVID-19 pandemic we used QCEW time series data that stopped in the final quarter of 2019, which is a time period that was unaffected by COVID-19. Figure 2 is a map of Kentucky counties that is based on jobs forecasts that show whether the county had a significant increasing or decreasing trend. Figure 2 shows there were large portions of the state with significant increasing (red counties) job demand prior to start of the pandemic. Also, there are groups of counties in the Eastern, Southcentral, and Western areas of the state with significant decreasing (blue counties) job demand prior to the beginning of the pandemic.
Figure 2: Pre-COVID-19 Job Projections for Kentucky Counties based on QCEW Space-Time Cube
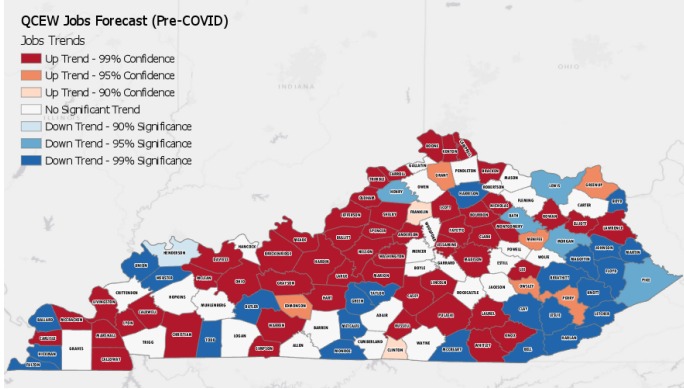 Figure 3 shows that many counties in Kentucky remain in the increasing categories
when the projections are based on data that include COVID-19 effects. However, the
map also reveals that many shifted from increasing to decreasing trends. For example,
there are counties (e.g., Jackson, Estill, Powell, Menifee) in Eastern Kentucky that
shift from non-significant or increasing trends to significant decreasing trends.
This shift in trends suggests that COVID-19 did negatively impact job demand in some
counties.
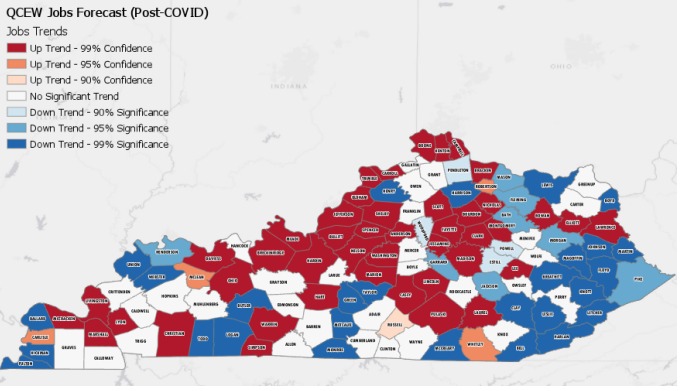
Figure 3 shows that many counties in Kentucky remain in the increasing categories
when the projections are based on data that include COVID-19 effects. However, the
map also reveals that many shifted from increasing to decreasing trends. For example,
there are counties (e.g., Jackson, Estill, Powell, Menifee) in Eastern Kentucky that
shift from non-significant or increasing trends to significant decreasing trends.
This shift in trends suggests that COVID-19 did negatively impact job demand in some
counties.
Figure 3: Post-COVID-19 Job Projections for Kentucky Counties based on QCEW Space-Time Cube
 While the maps in Figures 2 and 3 show how the county job projections have changed,
it is easier to see this trend by analyzing one map that includes both pre-and post-COVID-19
effects. Figure 4 shows a single map with differences between the pre- and post-COVID
job projections. If a county is shaded blue, it indicates the county’s projected job
numbers are significantly lower than the pre-COVID-19 job trends. If a county is red,
it means the county’s job projections are higher when the new 2020 data is included
in the job projections. As seen in Figure 4, most counties in the state have lower
projected job numbers after the 2020 job data is included in projections, but this
is not the case in every county. Nonetheless, the clear pattern throughout the state
is that COVID-19 has had a significant negative effect on the projected number of
jobs in Kentucky counties. Also, the map reveals that the negative effect of COVID-19
on jobs is not consistent throughout the state as many counties have strong statistical
signals indicating significant jobs losses (dark blue counties).
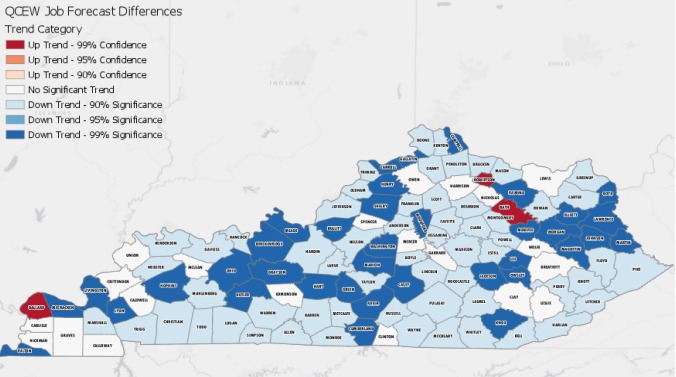
While the maps in Figures 2 and 3 show how the county job projections have changed,
it is easier to see this trend by analyzing one map that includes both pre-and post-COVID-19
effects. Figure 4 shows a single map with differences between the pre- and post-COVID
job projections. If a county is shaded blue, it indicates the county’s projected job
numbers are significantly lower than the pre-COVID-19 job trends. If a county is red,
it means the county’s job projections are higher when the new 2020 data is included
in the job projections. As seen in Figure 4, most counties in the state have lower
projected job numbers after the 2020 job data is included in projections, but this
is not the case in every county. Nonetheless, the clear pattern throughout the state
is that COVID-19 has had a significant negative effect on the projected number of
jobs in Kentucky counties. Also, the map reveals that the negative effect of COVID-19
on jobs is not consistent throughout the state as many counties have strong statistical
signals indicating significant jobs losses (dark blue counties).
Figure 4: Pre- and Post-COVID-19 QCEW Forecast Differences based on QCEW Space-Time Cube
 The importance of the map shown in Figure 4 is that the space-time cube allows for
analysis of time trends across all 120 counties simultaneously. The space-time cube
allows a 2D map to represent a 3D data structure, which reveals important tends in
the data. Specifically, the general understanding is that COVID-19 has negatively
impacted jobs everywhere, but the map in Figure 4 shows us that jobs have been impacted
in some counties in ways that are more significant than others. Also, the map in Figure
4 is important because it allows for the display of declining job projections relative
to any particular county’s own trend (i.e., it eliminates the problem of displaying
spatial data where a small number of counties have a large proportion of the total
jobs in the state).
The importance of the map shown in Figure 4 is that the space-time cube allows for
analysis of time trends across all 120 counties simultaneously. The space-time cube
allows a 2D map to represent a 3D data structure, which reveals important tends in
the data. Specifically, the general understanding is that COVID-19 has negatively
impacted jobs everywhere, but the map in Figure 4 shows us that jobs have been impacted
in some counties in ways that are more significant than others. Also, the map in Figure
4 is important because it allows for the display of declining job projections relative
to any particular county’s own trend (i.e., it eliminates the problem of displaying
spatial data where a small number of counties have a large proportion of the total
jobs in the state).
Question 2: How can space-time cubes be applied to data commonly encountered by KCTCS IR staff?
The QCEW data used to produce the space-time cube for jobs in Kentucky counties may be used less frequently by KCTCS IR offices when compared to internal data on colleges. Therefore, to further demonstrate the applicability of space-time models we explore trends in KCTCS enrollment. In this section, we link time series data tracking fall enrollment by student home county, between 2000 and 2019, to create a space-time cube. Figure 5 shows the space-time cube of enrollment trends over time.
The bottom of each tower is the first enrollment observation in 2000 and the top of each tower is the final observation in 2019. Again, notice that the space time cube shows many counties have had oscillating enrollments numbers over time while other counties have had stable enrollment numbers over time.
Figure 5: 3D Visualization of KCTCS Enrollment Trends
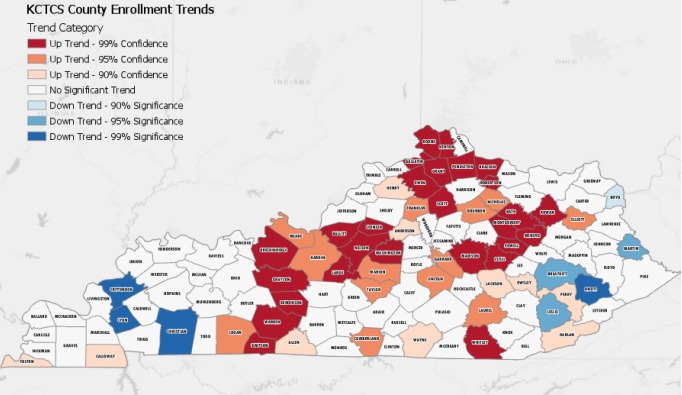
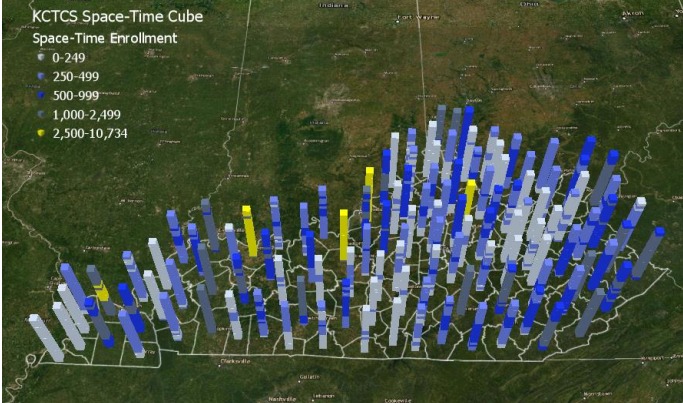 Figure 6 provides another example of how time series data and space-time cubes can
be used to reveal insights from data commonly used in IR offices. In this example
we use the space-time cube for KCTCS county enrollments to highlight counties based
on their trends in enrollment between 2000 and 2019. The map reveals that several
counties in the state have experienced increasing enrollment trends, and a few counties
have experienced declining trends. Most counties have had non-significant enrollment
trends which indicates that those counties have had consistent trends over time and
are not trending in a particular direction. Figure 6 shows counties in Northern Kentucky,
along the Bluegrass Parkway and Interstate 65 corridors, and a cluster of counties
east of Lexington are trending upward in their enrollment numbers. The eight counties
with decreasing enrollment trends are in the far Eastern and Western parts of the
state. This example illustrates the potential utility of space-time modeling in better
informing educational decision making as we can observe trends in enrollment by county,
which may be used for research, marketing, and outreach objectives.
Figure 6 provides another example of how time series data and space-time cubes can
be used to reveal insights from data commonly used in IR offices. In this example
we use the space-time cube for KCTCS county enrollments to highlight counties based
on their trends in enrollment between 2000 and 2019. The map reveals that several
counties in the state have experienced increasing enrollment trends, and a few counties
have experienced declining trends. Most counties have had non-significant enrollment
trends which indicates that those counties have had consistent trends over time and
are not trending in a particular direction. Figure 6 shows counties in Northern Kentucky,
along the Bluegrass Parkway and Interstate 65 corridors, and a cluster of counties
east of Lexington are trending upward in their enrollment numbers. The eight counties
with decreasing enrollment trends are in the far Eastern and Western parts of the
state. This example illustrates the potential utility of space-time modeling in better
informing educational decision making as we can observe trends in enrollment by county,
which may be used for research, marketing, and outreach objectives.
Figure 6: KCTCS Enrollment Trends by County
Conclusions and Recommendations:
This research brief highlighted recent efforts to develop a GIS application designed to align employment and workforce data and how the techniques used for the GIS application may be applied to enhance data analyses in IR offices. The GIS application incorporates a variety of data sources and an important challenge is determining the best ways to visualize data so users can find meaningful relationships and policy implications. Specifically, this research brief demonstrated how space-time cubes can be used to create 2D maps to visualize data that has a third dimension (time trend), and how space-time cube analyses can be used to provide meaningful, 3D visualizations of common IR data.
The data explored in this report showed that COVID-19 has significantly impacted jobs in Kentucky counties. The pre-COVID-19 forecasts for jobs were significantly higher than the post-COVID-19 forecasts that incorporate new data from QCEW. Additionally, the analysis showed that many counties have enrollment trends that have been either increasing or steady, and that eight counties have significant declining enrollment numbers.
There are several recommendations based on the findings of this report and the GIS application research that can be applied to IR research:
- It is important to recognize the importance of considering multiple dimensions of data. This report showed that both spatial and temporal aspects of data can be used to better understand key insights into research questions.
- Jobs in Kentucky have been significantly impacted by COVID-19, which means research related to workforce education and outcomes should consider how the changing landscape of jobs during the COVID era has impacted the demand for workforce training.
- Space-time models should be applied to commonly used IR data. To use space-time models, data must include both geographic and temporal references, which is possible to obtain from KCTCS’ Decision Support System. Variables like home college/FICE code, home county, term, and academic year can be used to aggregate and link student information to both geographic and temporal aspect of data. To learn more about space-time cubes, explore the following resources at ESRI.