Tracking Kentucky’s Production of High School Graduates across KCTCS Enrollment Clusters: Looking Forward to 2026 and 2030
Introduction:
A key concern in higher education is the future supply of high school students available within the education pipeline. The Western Interstate Commission for Higher Education (WICHE)1 predicts the national number of high school graduates will increase through the mid-2020’s and then enter a period of moderate decline through the mid-2030’s. However, there is significant uncertainty in predicting the number of public high school graduates due to factors like increasing high school participation and graduation rates, COVID-19, home schooling, and private schooling. Also, significant variation can occur across locations as some areas may experience growth due to urbanization or decline as members of a community relocate to seek better job opportunities. To fully meet the future needs of Kentucky’s workforce, postsecondary institutions in the Commonwealth must tap into all available populations to generate the volume of trained workers required. To meet future workforce needs, strategic planning efforts related to Kentucky’s education pipeline must be multifaceted by including strategies focused on both traditional and adult populations. While all elements of the education to workforce pipeline are important, this report focuses on one element of the pipeline – high school graduate production – to provide KCTCS institutions with information that may help inform strategic planning, enrollment, programming, and student support efforts.
Over the past year, the Office of Research and Policy Analysis (ORPA) developed a GIS application designed to track and forecast supply and demand of Kentucky’s education to workforce pipeline. One way the GIS application addresses these concerns is by producing county-level forecasts of various education and workforce variables. The forecasts are statistical guesses about what the future might hold for Kentucky and offer a forward-thinking approach to better understanding factors that might impact postsecondary education in the Commonwealth moving forward.
The present research brief applies data and analytics from the GIS project to examine the future of Kentucky’s high school graduate production. High school graduates are projected to both 2026 and 2030 to align with the upcoming strategic plan and strategic agenda cycles of KCTCS and CPE, respectively. The forecast procedure used in this report replicates WICHE’s approach by using lagged birth cohorts as predictors of future high school graduates. The report extends WICHE’s state-level reports by exploring high school graduates across KCTCS enrollment clusters, which accounts for within-state variation and allows for specific areas of the state to be examined.
One advantage of the GIS application is that it is designed to look at issues like high school graduate production at the county-level, which offers more specificity compared to state-level approaches. For example, WICHE’s Knocking at the College Door program projects high school graduates for the nation, regions, and states, but does not include projections for the counties or regions within Kentucky. Additionally, the county-level approach taken by the GIS application allows for flexible “bottom-up” aggregation to regions that are relevant to different entities. For example, county-level data can be aggregated to local workforce areas (LWA) and KCTCS enrollment clusters, the latter of which was used in this research to allow KCTCS colleges to better understand high school graduation trends in their areas.
1 Western Interstate Commission for Higher Education, “Knocking at the College Door: High School Graduate Trends – A glimpse of the future before COVID-19 intervened.” Accessed July 1, 2021, at https://knocking.wiche.edu/report/.
Data:
The high school graduate data for this research brief were collected from the Kentucky Department of Education’s (KDE) Superintendent’s Annual Attendance Report (SAAR)2 . The SAAR report is a required annual report submitted to KDE by school district superintendents. According to KDE, “SAAR is the core report used to determine funding based on attendance and provides a summary of each district’s aggregate attendance data for the entire school year.” Due to the pandemic, the most current data from the SAAR report is based on the 2018-19 academic year (SAAR was postponed during the pandemic). The SAAR data measure the number of students in each grade level and are available historically with consistent formatting back to 2008. All historical SAAR reports were compiled and converted into a county-year time-series dataset ranging from 2008-09 to 2018-19. The county data were then converted using a county[1]enrollment cluster crosswalk to produce the final dataset. The SAAR report does not include data on the number of high school graduates from each county because it is focused on counting enrolled students. However, the number of graduates for each county can be estimated by multiplying the data measuring 12th graders by the state high school graduation rate among the 12th grade cohort (97.5%3 ) which reduces the estimated number of high school graduates by 2.5% in each county. While imperfect, this approach provides a more conservative estimate of high school graduates than using unadjusted SAAR data measuring the number of 12th graders
To replicate WICHE’s forecasting approach, the report relied on vital statistics data provided by the Kentucky State Data Center (KSDC).4 The KSDC data were originally collected from the Kentucky Cabinet for Health and Family Services, Department for Public Health, Office of Vital Statistics5 . The data were provided by KSDC in time-series format measuring the number of live births in each county in each year from 1960 to 2019. The yearly births data for each county were used to create a new variable called “cohort year” that measures the year the birth cohort is expected to graduate high school (approximately 18 years later). The cohort year variable allows the birth data from the cohort years to be used within the estimation procedure as a predictor variable. An important point is that the final cohort year is from 2012 (i.e., people born in 2012 are expected to graduate high school in 2030), which means the predictor variables for future years already exist and do not have to be forecasted. This is an advantage because variables used to predict future events often must be forecasted as well, which introduces a potential source for estimation error. Using birth cohorts that have already been counted as predictor variables increases the confidence in the forecasts by ensuring the predicted graduates are controlled by the age-specific population most relevant for high school graduation.
2 Kentucky Department of Education. “Superintendent’s Annual Attendance Report (SAAR).” Accessed on July 1, 2021, at https://education.ky.gov/districts/enrol/Pages/Historical-SAAR-Data.aspx. 3 The 97.5% 12th grade cohort graduation rate was determined using the KDE Transition Readiness File. Accessible at https://openhouse.education.ky.gov/Home/SRCData.
Methods:
To analyze the time-series data a special algorithm was developed that identifies the best fitting model given the available data by minimizing the error of the predictions against observed data. The statistical technique employed by the algorithm is called autoregressive integrated moving average (ARIMA). The ARIMA alters the autoregressive and moving average components of the model until the ideal combination is identified. After the completion of the forecast procedure, the best models are automatically selected using model fit statistics.
Results:
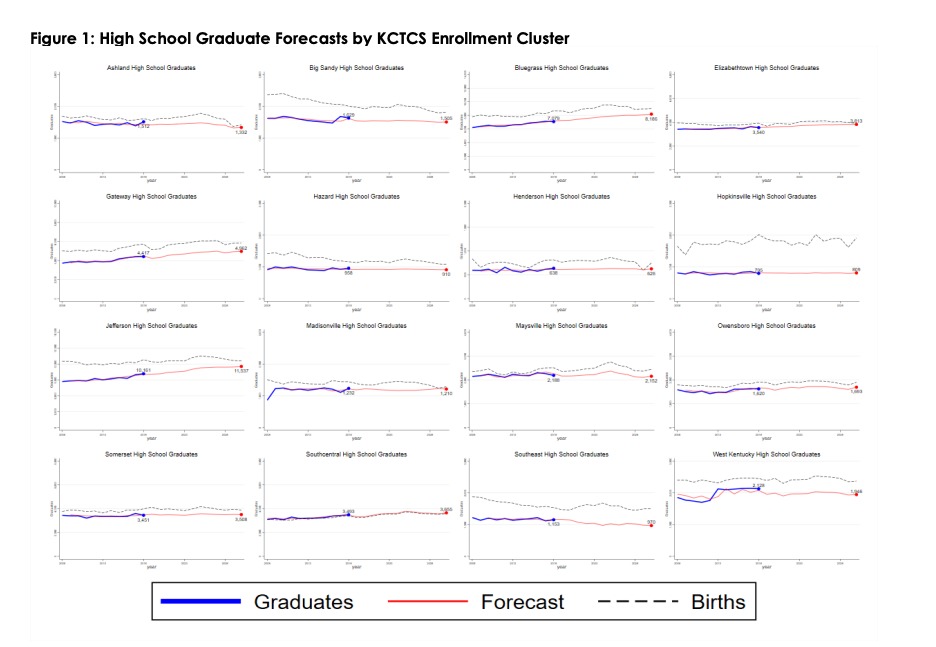
Figure 1 is a matrix of time-series graphs that visualizes and highlights the results of the forecasting procedures for high school graduates. The blue lines in the charts show the years for which we have observed data (i.e., 2008-09 – 2018-19) and the red lines represent the forecasts out to 2030. The dashed lines show trends in the birth cohorts moving from year 1990 (aligned with 2008) to 2012 (aligned with 2030). The graphs show that, in general, high school supply within KCTCS enrollment clusters are steady as indicated by blue lines that have very little “wobble” or “frequency.” However, the supply of high school students in each enrollment cluster exhibit noticeable trends that show how graduate production is changing over time. The graphs also show a gap between the birth cohorts and the number of high school graduates, which may be explained by several unobserved variables.
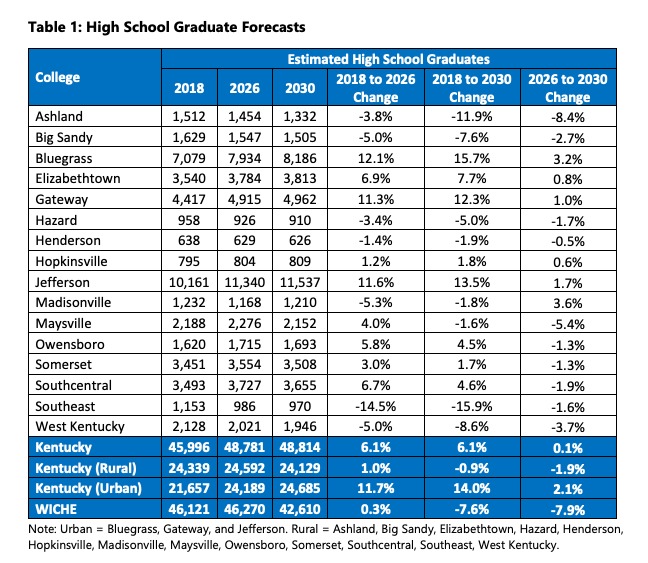
Table 1 highlights the predicted change in high school graduates between 2018 and 2026 and
4 Kentucky State Data Center. Vital Statistics. Accessed on July 9, 2021 at http://ksdc.louisville.edu/data[1]downloads/vital-statistics/. 5 Kentucky Cabinet for Health and Family Services: Office of Vital Statistics. Available at https://chfs.ky.gov/agencies/dph/dehp/vsb/Pages/default.aspx.
2030. 2026 and 2030 are highlighted because of the importance of those years for KCTCS and CPE planning efforts. The table shows that the overall supply of high school graduates is projected to increase by 6.1% by 2026 and then remain steady at 6.1% out to 2030. When the total number of graduates in Kentucky is split between urban and rural areas, urban areas (Bluegrass, Gateway, and Jefferson) are projected to increase by 14% and rural areas (Ashland, Big Sandy, Elizabethtown, Hazard, Henderson, Hopkinsville, Madisonville, Maysville, Owensboro, Somerset, Southcentral, Southeast, and West Kentucky) are projected to decrease by 0.9% by 2030. This finding suggests urban and rural areas within the state have diverging trends in high school graduate production, which is primarily being driven by similar changes in population. However, deeper inspection reveals more nuance to this finding.
Looking at specific colleges shows Ashland6 (-3.8%, -11.9%), Big Sandy (-5.0%, -7.6%), Hazard (-3.4%, -5.0%), Henderson (-1.4%, -1.9%), Madisonville (-5.3%, -1.8%), Southeast (-14.5%, -5.9%), and West Kentucky (-5.0%, -8.6%) are expected to experience declines through 2026 and 2030. Alternatively, Bluegrass (+12.1%, +15.7%), Elizabethtown (+6.9%, +7.7%), Gateway (+11.3%, +12.3%), Hopkinsville (+1.2%, +1.8%), Jefferson (+11.6%, +13.5%), Owensboro (+5.8%, +4.5%), Somerset (+3.0%, +1.7%), and Southcentral (+6.7%, +4.6%) are projected to increase through 2026 and 2030. Maysville (4.0%, -1.6%) is projected to first increase by 2026 and then decline by 2030. These results show several of the enrollment clusters previously defined as rural are projected to have increases in high school graduates, but the increases are less pronounced when compared to Bluegrass, Gateway, and Jefferson. Among the rural enrollment clusters with increasing high school graduates are areas that include several of the state’s largest cities, including Elizabethtown, Owensboro, Hopkinsville, Bowling Green, and London, which may explain why several rural enrollment clusters have positive forecasts. However, more research is needed to explain the observed differences in high school graduation trends across enrollment clusters.
Overall, the results of the forecasts show a general growth in high school graduates in Kentucky until 2026. After 2026, the growth in high school graduate production is forecasted to flatten to a growth rate of 0.1% for the state. The pattern of growth shown in this report is consistent with WICHE’s projections that show an increasing period of high school graduate production followed by a period of decline. The results of this report also showed that the general pattern of growth in Kentucky is not homogenous across all regions of the state. There is substantial variation across KCTCS enrollment clusters suggesting a need to focus on both state-level and regional changes in high school graduate production.
6 The parenthetical shown next to each college in this paragraph presents the percent change between 2018 and 2026 (left number) followed by the percent change between 2018 and 2030 (right number).
Summary:
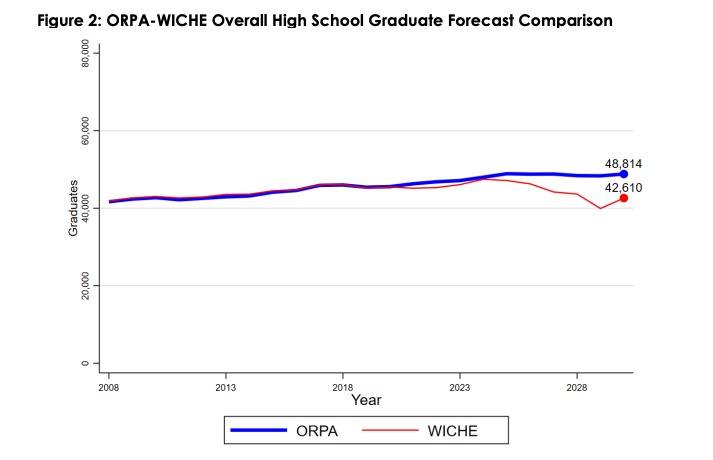
The analysis presented in this research brief shows Kentucky’s high school population is predicted to increase steadily by 2026 and then flatten by 2030. The results also show that the projected increase is not predicted to be dramatic or homogenous across all areas of the state. The previously mentioned Western Interstate Commission for Higher Education (WICHE) predicted Kentucky will produce approximately 7.6% (-3,511) fewer public high school graduates between 2018 and 2030. The analysis presented in this report replicates WICHE’s prediction approach by using birth cohorts to predict high school graduates in the future, but the results showed Kentucky is projected to increase high school graduate production by 6.1% (+2,818). Figure 2 highlights the difference between ORPA’s and WICHE’s 2030 projections (difference = 6,204), which may be due to differences in how the graduate data were treated, and other decisions related to the forecasting models. Also, the differences in the results could be due to the level of aggregation of the analyses. For example, the analysis shown in this report indicate urban enrollment clusters are projected to see the sharpest increases in high school graduation by 2030. Because the analysis used in this report takes a bottom-up approach to estimate the overall predicted graduates for the state, the forecasts may be higher when compared to WICHE’s projections because they include stronger effects from the urban areas.
Ultimately, ORPA and WICHE are attempting to achieve a similar goal, which is understanding what the future of Kentucky’s high school production might be. Both prediction procedures are subject to error and attempt to do something very difficult – predict the future. However, while the predicted volume of students is slightly different, the ORPA and WICHE forecasts suggest a similar trend in the data – an initial period of increase to the mid-2020s and then a period of slower change through 2030. A limitation of both ORPA and WICHE’s prediction approaches is that they do not directly account for the general increase in high school attendance and graduation rates. To expedite the production of the report, a standard graduation rate was applied to estimate graduates from all counties, but we know graduation rates vary across the state. Inclusion of more accurate graduation rates to the time-series model would likely improve the overall predictions and should be an area of focus for future versions of these forecasts.
The central lesson learned from the research in this report is postsecondary institutions should continue to monitor the production of high school graduates because of the implications on Kentucky’s education to workforce pipeline. Urban areas of the state are more likely to experience growth in high school graduates when compared to rural areas, but not all rural areas in the state are declining. Additionally, the results suggest workforce development offices should focus on high school graduate production because many of the state’s most in-demand professions require a steady flow of employees with at least a high school education to fill entry level positions. However, the results of the forecast models also showed that growth in the production of high school graduates will slow by 2030, which means workforce development organizations should continue to focus on adult learners as an important source of labor. Further, it is important to understand where potential employees will be available as new companies look to establish new facilities, which encourages approaches that focus on monitoring Kentucky’s education pipeline in specific counties and regions. Finally, the importance of understanding the production of high school graduates is underscored by the rising significance of dual credit education and rising high school participation and graduation rates, which are accomplishments, but also require planning to understand their impacts.
Recommendations:
Overall, the findings of the report lead to several recommendations:
- Continue to monitor high school graduate production at small spatial scales to better
understand where high school graduate production is changing.
- This report offers an important extension of WICHE’s high school graduate projections by looking at KCTCS college enrollment clusters.
- Future analysis should consider smaller spatial units like counties to continue to expand our knowledge of high school graduate production.
- As efforts to monitor high school graduation continue, efforts should be made to identify
areas of impact.
- Focus on increasing the number of high school graduates that enroll at KCTCS.
- Focus on increase the number of dual credit students that matriculate to credential-seeking status at KCTCS.
- Continue to increase efforts to improve access to postsecondary education by focusing recruitment on underserved populations, reducing costs, and alleviating non-academic barriers.
- To reach CPE’s target of 60% of the population obtaining a credential by 2030, focusing
exclusively on the traditional high school-to-college pipeline will not be enough.
- Efforts should be made to increase credential completion among non-traditional students like adult learners.
- Efforts should be made to help increase capacity for non-traditional students by ensuring easy access to programs across locations.
- Increase the focus on workforce credentials that lead to high-wage, high demand jobs in targeted industry sectors.
- Efforts should be made to continue to close the gap between birth cohort size and the number of graduates 18 years later, which requires investment in the entire P-20 pipeline.
Conclusions:
Creating a better understanding of Kentucky’s future production of high school graduates is an important step in learning how the flow of students through the education pipeline will change over time. As Kentucky marches forward into the next decade, education leaders should continue to monitor trends as both postsecondary institutions and workforce development professionals have stakes in understanding the geographic and temporal shifts in high school graduate production. These trends indicate there are many high school students who still need to be served by Kentucky’s postsecondary institutions to eventually fill the ranks of Kentucky’s workforce. However, the report also points to an urbanizing state with several areas losing population and likely needing support to handle the changing landscape.
While providing precise explanations for the observed trends in high school graduation is not the focus of this report, more research is needed to better explain the observed trends. First, there appears to be a relationship between urban areas, high school graduation, and population change. Second, there are additional variables that future research should consider, including poverty, public health, and migration. A better understanding of the effects of these variables will help explain the observed variation in high school graduation trends across the state. Also, a better understanding of how these variables impact high school graduation and population change will provide additional confidence in projections about the future. Third, more research is needed to better understand the gaps between birth cohort counts and high school graduation counts. We know some of the gap between birth cohorts and high school graduation can be explained by graduation rates, but it is likely that factors like early mortality, migration, and incarceration are also playing a role.
Overall, the projections provided in this report are a step forward in understanding high school graduate production in Kentucky because they move beyond state-level projections and are specific to each of the colleges within KCTCS. Also, the analysis in this report reveals additional areas of need for research that will be considered in future reports. Finally, the projections of high school graduates created for this report can be utilized as predictors for other variables that may be sensitive to the number of high school graduates. For example, forecasting the number of students who matriculate to KCTCS colleges from Kentucky high schools is likely sensitive to the number of high school graduates being produced. A continuous effort to improve our ability to forecast these trends will benefit KCTCS and the Commonwealth and help move us toward a better understanding of Kentucky’s education to workforce pipeline.