Enrollment and the Great Recession
During the Great Recession community colleges experienced historically high enrollment growth in response to negative economic circumstances (Barr & Turner, 2015; Hillman & Orians, 2013). Notably, the Great Recession, which was infamous for high unemployment rates, produced significant changes in higher education. Mullin and Philippe (2009) found enrollment expansion caused by the Great Recession resulted in many colleges adapting to changes by increasing capacity, altering policies, and extending community outreach to populations most affected. Schmidt (2018) explored postsecondary enrollment before, during, and after the Great Recession and found total postsecondary enrollment increased from 17.2 million students in 2006 to 20.4 million students in 2011, and then decreased to 19.1 million students after the peak of the Great Recession subsided. Schmidt (2018) showed that a majority of the enrollment increases occurred at the undergraduate level, and that students not enrolled prior to the Great Recession contributed the most to enrollment increases. Furthermore, gains in enrollment during the Great Recession were significantly impacted by growth among underrepresented minorities and older students, and the growth was most prevalent at 2-year and for-profit institutions. Despite the clear association between the economy and postsecondary enrollment, few studies have explored how this association might be used to predict future enrollments at community colleges and inform strategic planning and enrollment initiatives. In this research report we explore how the Great Recession impacted KCTCS enrollments and how we can use this information to predict what might happen in the future.
Growth in postsecondary enrollment during a period of significant economic decline may seem counterintuitive to many observers, but past research shows enrollment follows a countercyclical pattern (Hillman & Orians, 2013). Gustman and Steinmeier (1981) explored the enrollment and labor decisions of teenagers in the 1970s and found that the unemployment rate and wages were important factors in their decision to go to college. Betts and McFarland (1995) found that a 1% increase in unemployment predicted a 4% increase in full-time community college enrollment and Dellas and Sakellaris (2003) showed postsecondary enrollment exhibited a strong countercyclical relationship with the economy. Hillman and Orians (2013) found a 1% increase in unemployment was associated with a 1- 3% increase in enrollment demand at community colleges. These studies highlight the role that the economy plays in the choice to attend college and shows institutions may benefit from this knowledge by anticipating changes in the economy.
Based on past evidence suggesting the economy has countercyclical effects on postsecondary enrollment, it is important to note that the economic climate since the peak of the Great Recession is characterized by historically low unemployment rates and overall strong market performance. For example, according to U.S. Labor Department (2019), the national unemployment rate in 2018 was 3.9% compared to an average unemployment rate in the peak of the Great Recession of approximately 10%. Demonstrating the relationship between the positive economic environment after the Great Recession and community college enrollments, data from the National Student Clearinghouse Research Center (2019) shows that two-year public enrollment declined from 5,291,753 students in 2018 to 5,114,013 students in 2019, representing a 3.4% decline. Thus, the current state of enrollment at community colleges is characterized by consistent enrollment decline and/or stagnation.
KCTCS Enrollment Before, During, and After the Great Recession
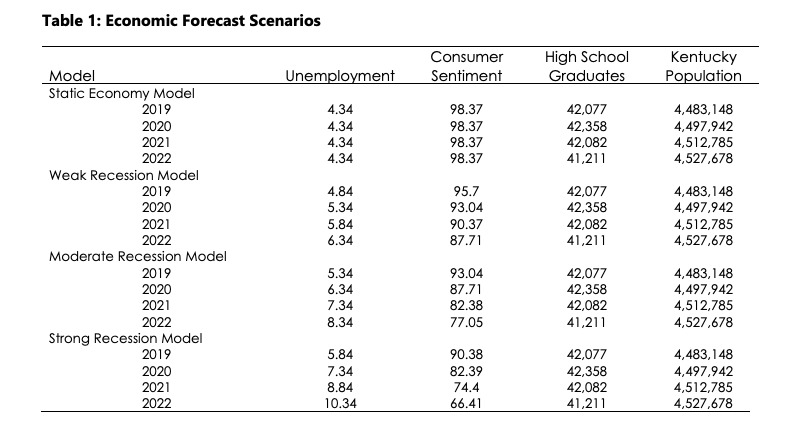
Forecasting KCTCS Enrollments
Regression Analysis
The first step in the analysis was to estimate ordinary least squares regression (OLS) models to test the significance of variables that have strong theoretical connections with postsecondary enrollment. Also, the regression analysis allows us to determine how much change in enrollment we should expect given changes in specific variables. These variables were the Kentucky unemployment rate, the Index of Consumer Sentiment, population, the number of high school graduates in the previous year, and the tuition rate. We do not report the results of the original OLS model as it was primarily used to check the appropriateness of including all the variables together in one model. We used a diagnostic statistic called variation inflation factors as a post-hoc test of the OLS model, which revealed that the tuition rate variable caused instability in the model because it was too highly correlated with other variables. Thus, the tuition rate variable was excluded, which greatly improved the overall fit of the models. Next, because the data were modeled as a time-series it was important for the regression model to account for autocorrelation, which is a condition that occurs when the previous year’s enrollment predicts the following year’s enrollment, and thus, the data points are not independent of one another (a serious problem in regression analysis). Thus, an adjustment was made to the standard errors in the model using a technique developed by two statisticians named Newey and West. The results of the Newey-West model are presented below.
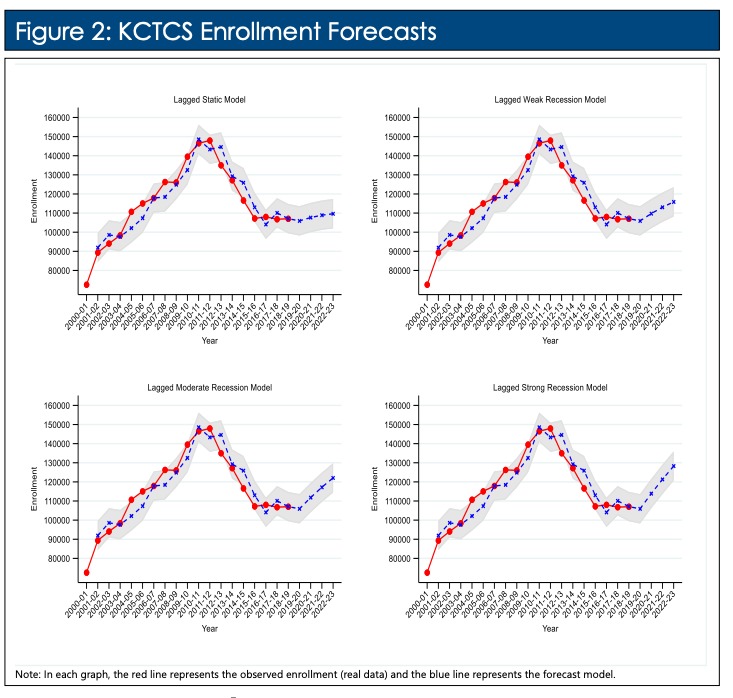
Forecasting Models
Given our focus on predicting future enrollment at KCTCS, we also estimated forecasting models that are designed to predict future enrollments based on multiple variables that the regression analysis shows have significant effects. To accomplish this, we used a modelling technique called Autoregressive Integrative Moving Average, or ARIMA for short. This approach is used when diagnostic tests reveal that the time-series exhibits significant autocorrelation and a condition called stationarity, both of which are present in the data.
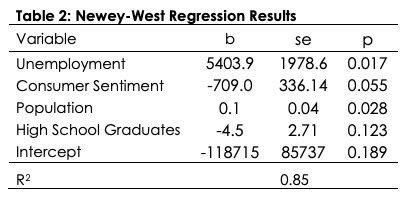
Regression Results
Table 2 presents the results of the Newey[1]West regression model estimating the effects of the independent variables on enrollment. The results show that all of the variables in the model except high school graduates are significant (p<.10). The result for the unemployment rate show that a 1%increase is expected to increase KCTCS enrollment by 5,404 students. Consumer sentiment has a significant negative effect on KCTCS enrollment where a one unit increase in consumer sentiment reduces the expected enrollment at KCTCS by 709 students. Thus, it appears that an increase in the local unemployment rate increases enrollment while improvement in the national economy decreases enrollment. Both effects support the hypothesis that a declining economy increases enrollment at KCTCS while controlling for population size and the number of high school graduates.
The results of the Newey-West regression model were very robust given the number of variables included in the model. The R2 value describes how much of the variation in enrollment is explained by the variables in the model. Combined, the variables included in the model explained 85% of the variation in enrollment - a very strong relationship. However, this result means that there is an additional 15% of the variation in enrollment that is unaccounted for by the model. This implies there are other non-economic sources of enrollment variation that might include enrollment initiatives, scholarships, and dual credit/dual enrollment.
Conclusions
lower enrollment and tuition revenue. This should not be understood as a failure of enrollment initiatives put forward by KCTCS, but rather, the sensitivity of KCTCS enrollment to economic cycles. The results presented in this report should also not be interpreted as meaning KCTCS can do nothing about enrollment. Future research should explore the possibility that enrollment initiatives put in place throughout the system helped stave off even steeper declines during recent periods of economic strength. Further, 15% of the variation in enrollment remains unexplained by the model, leaving room for KCTCS to significantly impact future enrollment. Finally, the results presented in this report highlight the potential for coming gains in enrollment as the economy cycles back to normal levels of economic performance. Current economic outlooks are uncertain, but historic trends suggest that the economy will not continue to perform at peak level
References:
Barr, A., & Turner, S. (2015). Out of work and into school: Labor market policies and college enrollment during the Great Recession. Journal of Public Economics, 124, 63-73.
Betts, J. R., & McFarland, L. L. (1995). Safe port in a storm: The impact of labor market conditions on community college enrollments. Journal of Human resources, 741-765.
Dellas, H. & Sakellaris, P. (2003). On the cyclicality of schooling: Theory and evidence. Oxford Economic Papers, 55(1), 148-172.
Gustman, A. L., & Steinmeier, T. L. (1981). The impact of wages and unemployment on youth enrollment and labor supply. The Review of Economics and Statistics, 553-560.
Hillman, N. W., & Orians, E. L. (2013). Community colleges and labor market conditions: How does enrollment demand change relative to local unemployment rates?. Research in Higher Education, 54(7), 765-780.
Mullin, C.F., & Phillippe, K. (2009). Community college enrollment surge. AACC policy brief series. Washington D.C.: American Association of Community Colleges. National Student Clearinghouse Research Center (2019). Current term enrollment 2019.
Schmidt, E. (2018). Postsecondary enrollment before, during, and since the great recession. Washington D.C.: United States Department of Commerce: Economics and Statistics Administration